The Road Already Tells You Who's Watching. We Just Read it!
MapZot.AI turns road‑level traffic counts, speed, and congestion into verified impressions for every billboard, transit shelter, and digital screen, segment by segment, hour by hour.
Most OOH audience numbers are still guesses dressed up as data.
Panel surveys and modeled reach curves tell you roughly how many people live near a board. They don't tell you how fast traffic was moving past it at 5pm on a Thursday, how congested the block gets, or how many of those drivers passed the same spot twice. MapZot.AI starts from the road itself — actual vehicle counts, actual speeds, actual congestion — and builds the audience number up from there.
From a pin on the map to a delivery report, in three steps
Every OOH impressions report starts the same way you'd plan the campaign — by location, not by spreadsheet.
Select the road or draw a polygon
Click a segment like South Van Ness Avenue, or draw a custom polygon around a set of boards. MapZot.AI pulls every road segment inside it — 148 in a typical urban block — with its own traffic count.
Set your radius and flight length
Choose a reach radius from selected-road only up to a full mile, then set the campaign length from a single day to a multi-week flight. The estimate recalculates instantly.
Download the impressions report
Get a spreadsheet with total campaign impressions, average daily impressions, estimated attention in seconds, and a repeat-audience index — ready to send to a client or trading desk.
Try the same controls planners use every day
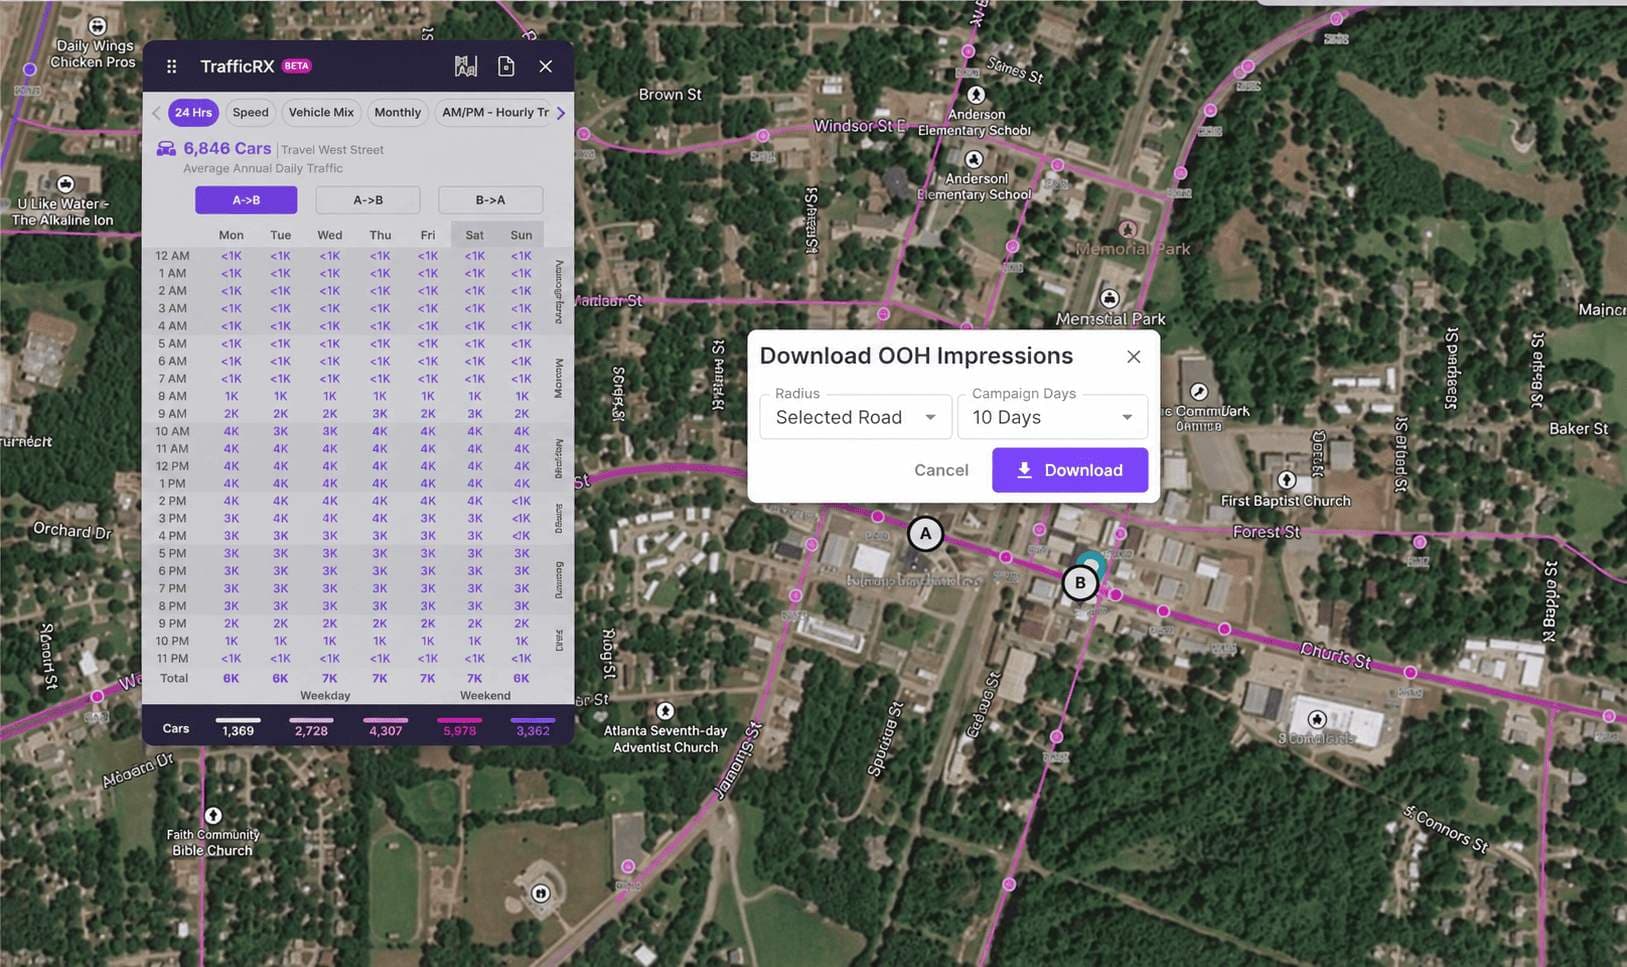
This mirrors the "Download OOH Impressions" panel inside TrafficRx. Change the radius or flight length and watch the estimate respond — it's the same underlying traffic model, just simplified for the web.
South Van Ness Avenue
US 101 North · average speed 16.1 mph · speed limit 25 mph · congestion: low
The impressions number is not the raw traffic count
Raw AADT tells you how many vehicles passed a point last year. It doesn't tell you how many of those drivers were actually in a position to notice a board this week. MapZot.AI applies three correction factors — for current speed against the posted limit, for how often a driver has already seen the board (loyalty), and for how confident the underlying sensor data is (calibration) — before it calls a pass-by an impression.
Every factor ships in the report, so a planner or auditor can see exactly how the top-line number was built, not just trust it.
| Factor | South Van Ness Ave |
|---|---|
| Calibration factor | 0.9999 |
| Speed factor | 1.0000 |
| Loyalty factor | 0.9057 |
| Attention index | 0.9057 |
| Raw average daily | 10,505,451.3 |
| Selected-day impressions (Mon) | 11,346,981 |
See the corridor from every angle before you buy
One dashboard, six views into the same road — switch between them without re-running an analysis.
Built for the people who buy, sell, and prove OOH
Media owners
Price inventory by actual passing traffic instead of a flat rate card, and back it up when a client asks why.
Agencies & planners
Compare boards across a market on the same terms — impressions, attention, and frequency, not just location.
DOOH networks
Feed programmatic pricing with live speed and congestion data instead of a static, once-a-year audit.
Municipalities
Review permit applications and ad placements against real traffic and safety data for the corridor.
Bring real traffic data to your next OOH plan
Draw a polygon, set your flight, and see what an evidence-based impressions report looks like for your market.