Halloween falls on a Saturday this year, and the calendar is only part of the story. American shoppers are on track to spend a record amount on candy, costumes and decorations, but they are doing it differently: starting earlier, hunting for value and splitting their trips among a wider mix of stores than ever before.
With the holiday just three days away, we looked at the latest industry data to answer a simple question for retailers, brands and landlords: which stores are drawing the biggest Halloween crowds in 2026, and why?
Key Takeaways
The National Retail Federation expects U.S. Halloween spending to reach $13.5 billion, up from $13.1 billion in 2025.
Discount stores are the top destination (39% of shoppers), ahead of specialty Halloween and costume stores (32%) and online (27%).
Spirit Halloween is back with roughly 1,590 pop-ups, including 85 former Party City spaces, and is a proven traffic magnet for neighboring tenants.
Michaels and Hobby Lobby are the main beneficiaries of Party City’s exit from physical retail, and Michaels launched its largest Halloween assortment ever.
Momentum heading into the season favors Five Below, Costco, Target and warehouse clubs, while Walmart’s growth is steadier and increasingly online.
Halloween shopping is front-loaded: 65% of online buyers surveyed said they start by mid-October.
Halloween 2026 at a glance
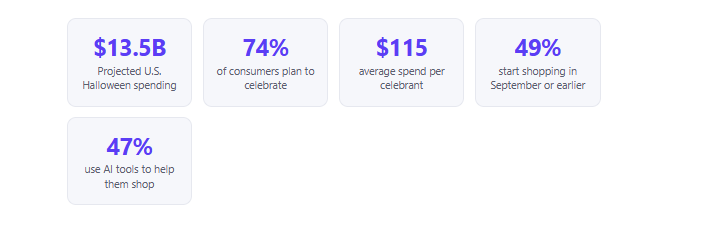
NRF’s annual survey of nearly 7,900 consumers paints a picture of a holiday that remains a spending priority, even as households watch their budgets. Shoppers are celebrating, but they are being deliberate about it.
The value-first shopper picks discount
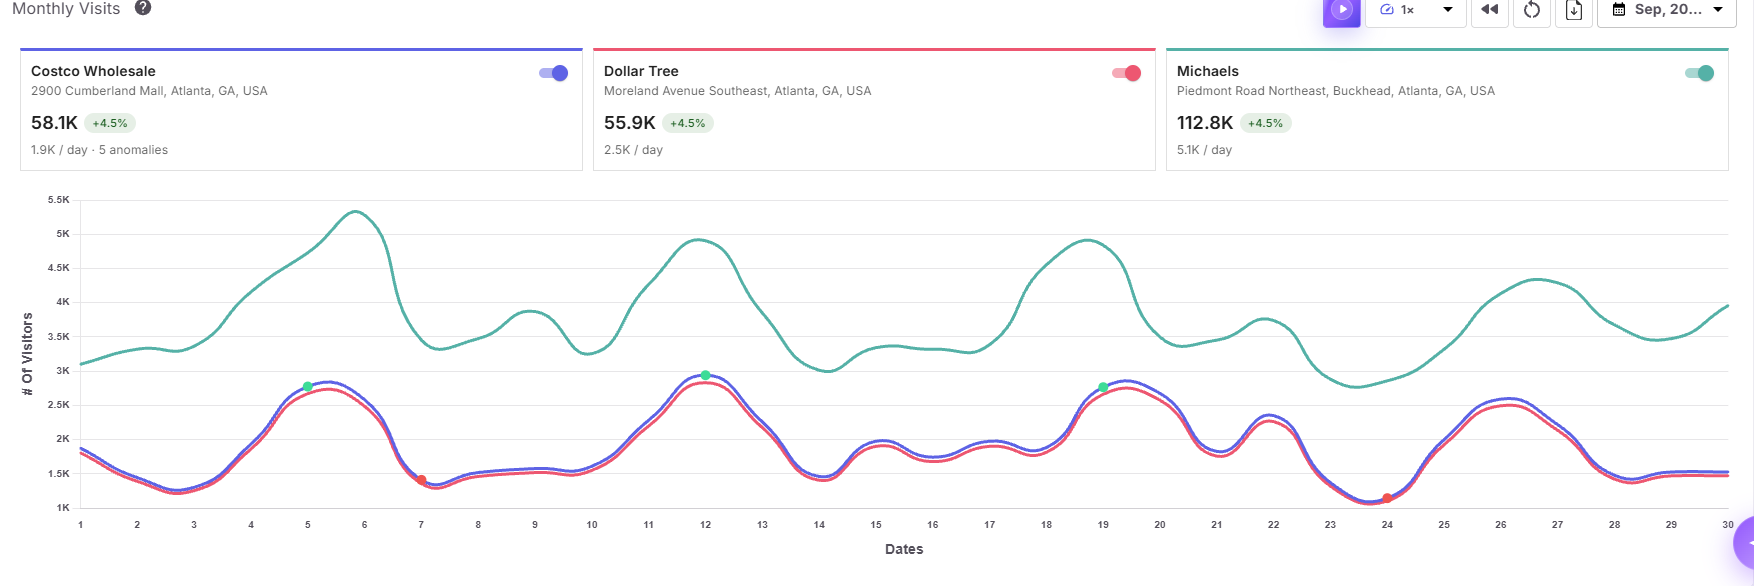
Location-level data from MapZot.AI shows how early the Halloween push begins. In September, a Michaels in Atlanta’s Buckhead neighborhood drew roughly 112.8K visits, about double the traffic of a Costco Wholesale at Cumberland Mall (58.1K) and a Dollar Tree on Moreland Avenue (55.9K). Michaels also ran noticeably higher than both on nearly every day of the month, with its biggest spikes landing on weekends, including a peak above 5K visitors on the 6th and strong readings again on the 12th, 19th and 26th. Costco and Dollar Tree tracked each other almost line for line, rising and falling together on the same weekly rhythm. All three locations posted the same +4.5% monthly gain, but Michaels’ much larger base shows where discretionary seasonal browsing, such as décor, crafts and party supplies, is concentrating before October even begins. For retailers and landlords, it is a reminder that the Halloween traffic window opens well ahead of the final weekend.
An earlier, longer season
When do Halloween shoppers start buying?
Share of surveyed online buyers, October 10–20, 2026
Source: Bizrate Insights, 1,784 online buyers surveyed immediately after checkout.
“Summerween” is no longer a novelty. Michaels revealed its Halloween collections in June, Home Depot was stocking animatronics in the spring, and Spirit Halloween opened its flagship on August 1. By the time October arrived, most of the season’s browsing was already done.
For store operators, the implication is clear: the biggest traffic windows are the weeks before the final weekend. Earlier industry analysis of Halloween visits found foot traffic building through October and peaking around the third weekend of the month across every U.S. region. A late-season Saturday finale still matters, but it is the cherry on top, not the whole sundae.
Which retailers are seeing the highest traffic?
Momentum heading into Halloween: year-over-year visit growth, Q2 2026
Latest full-quarter visit trends for key Halloween destinations
Source: Placer.ai Q2 2026 visit trend analyses. “~” indicates growth reported as just under 5%. These are quarterly trends, not Halloween-week counts.
1. Discount and mass retailers: Target, Walmart, Five Below
Because discount stores are the single most popular Halloween destination, the big-box and value chains capture the largest raw share of seasonal trips. The momentum behind them is uneven but strong. Five Below grew visits 19.8% year over year in Q2 2026, with trading cards and other trend-driven draws keeping crowds coming. Target has been in recovery mode, with July visits up 7.3% year over year, and it posted a 6.0% YoY gain during its October deal days. Walmart remains the volume leader, but its growth has been modest (+0.7% in Q2) as more of it shifts online.
2. Spirit Halloween
No retailer is as synonymous with the season. Spirit opened nearly all of its roughly 1,590 stores by mid-October, with most closing on November 2. This year, 85 locations moved into former Party City spaces, alongside 137 former JOANN and 93 former Big Lots sites. Beyond its own traffic, Spirit acts as a halo for the center it sits in: a Kalibrate study of 2024 data found that power and community centers with a Spirit store saw notable visit lifts versus centers without one, with the strongest uplift from mid-October into early November.
3. Michaels and Hobby Lobby
Party City was historically the October powerhouse: in 2024 its visits ran nearly 95% above its monthly average. With the chain gone from standalone retail (it now operates inside 700+ Staples stores and online), Michaels has moved aggressively to capture the demand, rolling out its largest Halloween assortment, a party shop, and in-store candy and banner bars. Craft chains posted double-digit YoY visit growth almost every week of the 2025 holiday season, and Michaels’ share of visits in its category climbed to roughly 40% in 2025.
4. Warehouse clubs: Costco, Sam’s Club and BJ’s
Bulk candy and party quantities make clubs a natural fit. Costco led the superstore and club set in Q2 2026 with visits up 8.2% YoY, while Sam’s Club, BJ’s and Target each grew just under 5%.
5. Candy and confectionery stores
Confectionery visits rebounded in October 2025, rising 7.3% year over year after just 2.2% the year before, according to PassBy’s analysis, and visits start climbing early in the month. Small-format, high-impulse trips like these tend to cluster in the final week before trick-or-treating.
What this means for retailers and real estate teams
For retailers: the season is won in September and the first half of October. Phase campaigns across August to October, lead with value, and use the final Saturday for convenience: candy, cards and last-minute fixes.
For landlords and CRE teams: seasonal tenants matter. Spirit Halloween turns empty big-box and in-line spaces into traffic generators for the whole center, and 2026’s mix of former Party City, JOANN, Big Lots and Rite Aid locations shows just how much vacant inventory is being put to work. Centers anchored by discount, grocery and craft tenants are best positioned to convert that traffic into spend.
For brands: with 47% of shoppers using AI tools to plan their Halloween shopping, discoverability in digital assistants now influences which store a customer walks into.
The bottom line
Halloween 2026 is a value-driven, early-starting, multi-channel season. Discount chains lead on destination share, Spirit Halloween and Michaels are the biggest beneficiaries of the Party City vacuum, and warehouse clubs and Five Below carry the strongest visit momentum into the holiday. Once the final weekend wraps, the real test begins: how much of this seasonal traffic carries into the November and December holiday rush.